We’re super excited to confirm that we have been able to make and test the necessary upgrades to our infrastructure to mitigate reports of slow load times (6+ seconds) on certain assets and paths on our system.
We have rolled out an update to our CDN nodes that should permanently fix these problems
This update is currently live and working well! You don’t need to do anything - just enjoy greater stability and speed
If you do see new occurrences of this error, please let us know immediately by replying to this post!
In order to be sure this is the same issue, we kindly ask that you include the x-nf-request-id or the HAR file where this problem occurs.
I see a significant improvement in load times on one of my sites impacted by this. Went from 16-18 seconds total load time to less than 4 now. Thank you!
We are SO pleased to hear that. We needed extra time to test our improvements at scale, which is why this fix took a bit to arrive, but I am very glad you are seeing improvements in that magnitude!
Hard to say what might have happened there, but it is definitely NOT related to the issue in this thread
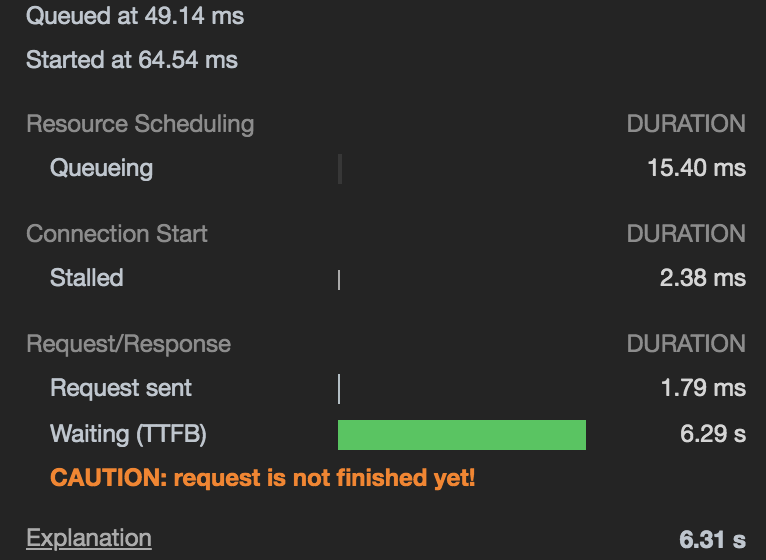
When I investigated, I can see that it took us 1 millisecond to receive the request and send the file when I looked in our internal logs, so it is likely something related to either your page layout (that asset is blocked in loading quickly by the way you load it - you’ll see “request queued” in the timing tab in that case), or your network (slow/busy/suboptimal DNS configuration).
You’ll probably want to look in your browser dev tools, in the timing tab, to see if you can tell any more details.
We still experience performance problems due to this issue. x-nf-request-id: ef05ba78-537b-485b-a662-2aa55a183046-6752665
What we find is that the JS bundle of 587KB takes 4-5 seconds to download initially. After a minute or so after we retrieve the file the download time improves, but after each deploy we get the same problem all over again. If this only happens to the first person who hits the site after een new deployment. Than it’s fine. But this happens to everyone who hits the website initially. That is not ok.
This is some other problem. The bug was reliably 6 second TTFB. You have a 543ms TTFB. We’ll still look into this, and thanks for including the x-nf-request-id so we can best do so!
The setup on that site is quite odd and I am surprised it works at all - you’re proxying to a branch subdomain which doesn’t generally work. I suspect that is slowing things down a bit, but the main reason for the problem is proxying a 2MByte file takes a hot moment (yes, we serve it compressed - but we transfer it from backing store uncompressed, so we are slinging 2MByte around the network twice for that request). Once it gets into CDN cache, it’ll probably work better, but I think it may never with your current config.
If you load that JS file from the other site (-dashboard) directly - how fast does it come down the pipe? after a few reloads, is it faster?
I’ve tested it just now and it is consequently fast (?) both for proxied branch and on a branch directly. Yes we have a weird setup. We’re still experimenting with it. Our use-case is that want the same web application to be used in the context of one specific customer, but also for all customers (no customer context). So for now it seems that I don’t have any problems anymore. Thanks for checking.
I have been experiencing abnormally long loading delays since I deployed a new site (Publii) some days ago, 30+ seconds when loading some images! This is my HAR file.
Hi, @pfelipm. I am seeing that the two slow loading files were 6744547 and 8681655 bytes respectively.
It also appears that other assets blocked until the download of these two files was completed.
Taking a closer look it appears the request came from Europe, but CDN node used was near San Francisco. The HTTP request would normally go to a CDN node in Europe so the wrong CDN node being used is likely a large part of the issue.
I checked the IP address returned globally for that domain here:
This test returned CDN nodes in Europe for request sources in Europe so I’m not sure why that isn’t reflected in this HAR file.
Would you please test making an DNS lookup locally for pablofelip.online a few times and let us know what IP address was returned? For example:
I know Netlify DNS is being used. We do GeoIP lookups of the IP address making the request and then direct to the closest CDN node for that location. This means the request should have gone somewhere closer and the response would have therefore been faster.
Were you perhaps using a VPN at the time? Can you think of any reason why DNS would have directed this request to North America and not Europe?
I am based in Spain. No VPN or anything similar in-between. The issue can be consistently reproduced in all my devices: mobile (wifi / 4G), tablet, laptop or desktop in two different locations (home & office). I use Cloudflare’s DNS at home (router) but the regular ones provided by my ISP in the office.
I’ve just performed some nslookup (x3, always this result), as suggested, from home location:
The weird thing is that the content never seems to arrive. The x-nf-request-id is fab32afb-02ed-4ec6-baa5-282890d2c07d-3508311, and I am making the request from NYC.
Quite unexpected! Those symptoms do correspond to the bug we fixed.
However in this case according to our internal logs, our system sent that response in slightly under 500ms AND your client “hung up” rather than letting us finish serving. Not sure where the rest of the timing went on that request…
Does the situation persist? As far as I can tell that asset loads pretty quickly now. To test this, I scanned every CDN node and saw response times of up to a few seconds; this makes sense since I was scanning from a single location that is quite network-far from some nodes and the content was not in cache on every node (yet). Upon second scan, cache was primed and I saw responses under 3s for all nodes (again, most of that was network time in many cases to get from Des Moines, IN, USA to e.g. Sydney, AU).
So - this is not a recurrence of that bug, but also, the particular load you quote was quite odd…You can see a graph showing similar results here (which you can cause to be updated if you ask for another load >1.5 hours from now):
I’ve been seeing the same issue (not sure if it’s this exact issue, but the symptoms seem identical) from Denver today:
The x-nf-request-id is 76754a3a-472f-49d2-92ce-5544b3bee4b1-2929587. I’ve loved Netlify as a service for the past couple of years, but this recent flakiness happening across multiple geographic locations is a bit worrying…
Well, I wish I could tell what was happening. That request was served in 0ms - it was read directly from cache and sent to your browser within even a single millisecond passing on our service, @yunyu. Not sure what is happening, but there seems to be something odd with your client. I don’t doubt your screenshot, but I also don’t think our service is the cause of it…
It was an HTTP 304 response, meaning we just instructed your client to use its local cache…
I don’t doubt your logs either, but is there a chance the 304 response itself took a while? I am seeing periodic TTFB spikes within a few minutes of deploys via Datadog.
Hi Netlify team, I’m quite happy that this is resolved, but looks like it still is an issue on our site https://www.codewave.com ( x-nf-request-id: d70a186d-8a66-49b2-9c07-f58481dbf82f-11069341)
We tried the same deployment with AWS S3 + Cloudfront - Pagespeed scores are close to 60 for mobile where as on netlify its about 30.
We have another deployment where this issue exists - for imarticus.org (paid plan).
Client is planning to move out of netlify as performance is impacting them badly.
We really love using netlify, but performance is costing us big time. Any quick help in resolving it is much appreciated.