I’ve multiple setups on AWS, cloudflare and Netlify (same repo) and have also recently moved in a bunch of sites to Netlify pro plan. The same setup is really fast on CF pages (<1s load), but I’ve been noticing lots of issues on Netlify (~4s load) which is completely degrading the user experience.
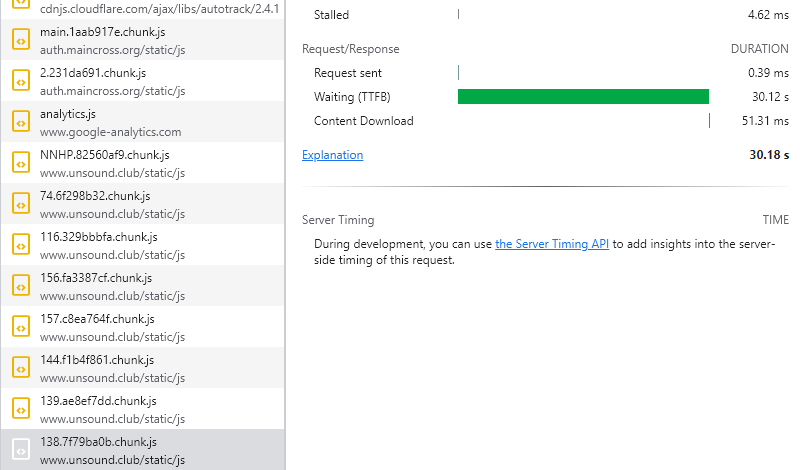
(Very) slow response times for some resources across various sites. Normal resources take between 200 and 800ms, while problem resources take between 1.5 seconds and 30+s.
Even if there is an occasional hit on some resources for 1st time load, why is it taking multiple seconds for revalidation. I can reload the same site after 1 min, and again it will take 4s for revalidation. Thats nuts.
Cache control setting of max-age=0 - this makes no sense at all on static resources. Why needlessly force the browser to check on these on every load?
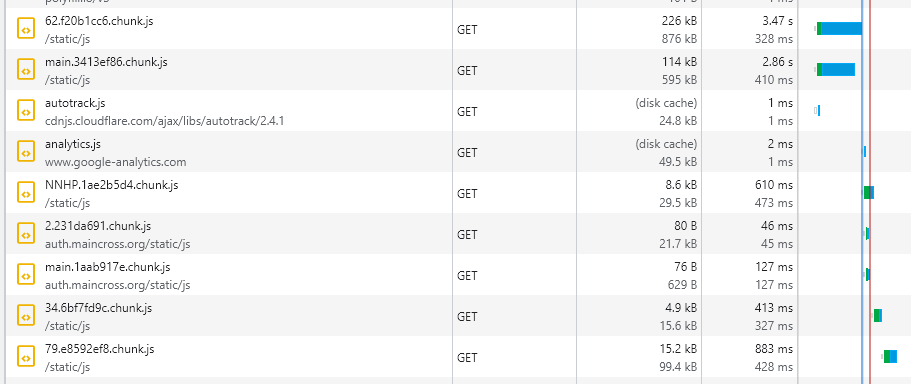
Some sites have a initial js bundle loading from cloudfront (with max-age set as expected: max-age=31556926), most of my sites don’t. And after the first bundle, all the rest come from Netlify. So is there a CDN even being used?
In most cases, we say 400 to 800 ms could be considered normal for assets on Netlify, but 1.5 or 30+ seconds? That’s a lot! I have personally never seen this happen and would love to dig deeper on this. Do you have the URLs that give such an error? I checked the request IDs that you sent, but a lot of those IDs return no matches in our logs - this would happen if the request failed prematurely. Did something like that happen?
I could see values in 150 to 600ms as TTFB for your websites.
I would like to explain here how our CDN works and how the fingerprinting of assets is a bad practice. Netlify relies on file names and their hash to determine the cache. When you fingerprint an asset, it doesn’t just invalidate that file, but all the others that reference to that file because the other files now need to include a new name. So for each of the CDN node, this new file now has to be requested from the origin server and then it’s saved to the CDN cache. Thus, we always advise against fingerprinting.
Cloudfront !== CDN. Cloudfront is where we store the assets optimised by post processing. With or without Cloudfront, Netlify is using a CDN as long as the DNS is correctly setup.
I checked the request IDs that you sent, but a lot of those IDs return no matches in our logs - this would happen if the request failed prematurely. Did something like that happen?
How is that possible? I have the HARs for all of these. The request doesnt fail - it just takes a lot of time, but succeeds.
I would like to explain here how our CDN works and how the fingerprinting of assets is a bad practice.
No sure why you brought up fingerprinting etc into this. Its revalidation as done by Netlify. Nothing that I am doing.
Be that as it may be, the fact that its taking so long makes it a problem.
This is a serious problem that is happening across all the sites intermittently and now I have customers complaining. I’d really like to get a solution.
I can see it happening here and there myself. Here’s the latest instance on maincross.net.
Thanks for those request ID’s, very much what we needed. I’ve asked our team to look into this for us since those requests do not seem otherwise problematic in our internal logs, but the timing does line up with what you’re seeing in your dev tools, so this is not the frequently observed case of “we sent quickly, but it arrived slowly”. I imagine they’ll be able to look into this for us late this week and we’ll follow up once they do!
Thanks so much for following up with additional information. We have opened an issue with the relevant internal team to look into this further. We will follow up on this thread when we have more insights.
If anything changes in the interim, please let us know!
We could use one more examples, if you come upon it now! Team is still working on a resolution of this situation for us. They’re not too sure of the root cause so have thus far added logging (since your last post) and it would be helpful to get one more for them to check into.
thank you, @zehawki - i have passed this info back to the team who are working on investigating this. It is still being looked at, and we will definitely give you an update as soon as we have news to share. thank you for your patience!
hi there @zehawki - we were able to make some small changes that you might see making some improvement, but we are also planning a more long-term remediation (updating some much more central underlying dependencies) that should hopefully fix things for good.
hey there zehawki, i’m sorry the sites seem to be loading so slowly. we will look into this further as soon as we can. i have passed the info you supplied back to the team.
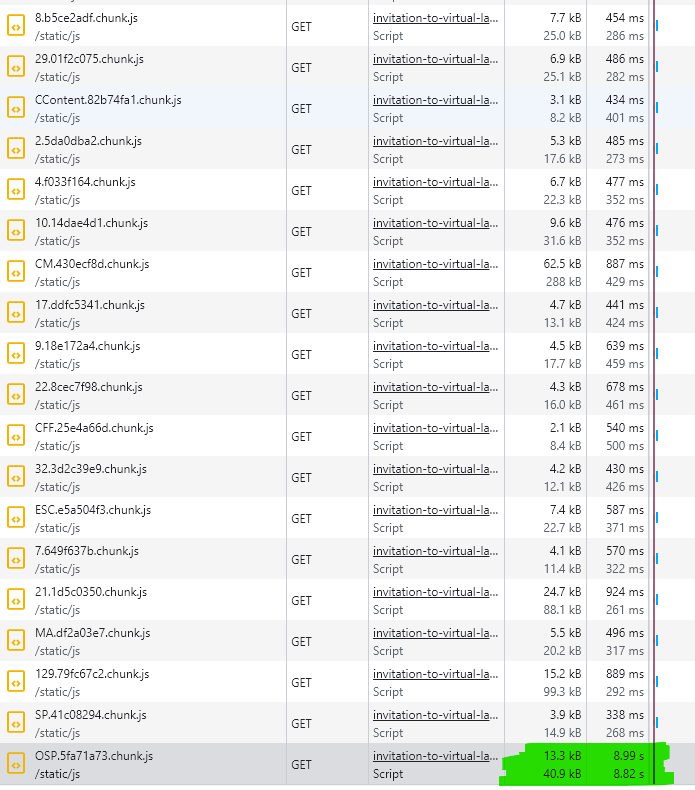
Hey @zehawki and thanks for your patience while we worked on this! I believe that we have (this week, since your last post) resolved the slow static asset loading situation - what I think you show in all screenshots except for your very last one. Please let us know if that slow load - 6+ seconds on a static file - recurs!
Your last screenshot seems to be something different - you don’t show the status, but since the assets are named in red, I expect it was some kind of HTTP error (400+ return status). That would almost certainly be a separate issue (issue we resolved:
slow but successful loads in the 6-8 second range), which we are of course happy to work with you on but do need to know either a request ID, or at least a timestamp with timezone, complete URL, and status, to dig in more deeply on those.
Thanks, I can see that in our internal logs with the same timing, and don’t understand what led it to be so slow, so I’ve asked our dev team to look into this presumably new-cause situation for us and will follow up as soon as I get some details!